Virtual Water
Virtual water is the total volume of freshwater used to produce a good or service. The concept captures the water that is 'embedded' in a product across its entire supply chain, so that when the product is traded, the underlying water resource effectively travels with it, redistributing pressure on the world's river basins.
Origin of the concept
- 1993: Professor John Anthony (Tony) Allan introduced the concept of virtual water to explain how water-scarce regions such as the Middle East import food (and the water embedded in it) instead of producing it domestically. He was awarded the Stockholm Water Prize in 2008 for this work.
- 2002 onwards: Arjen Hoekstra developed the related water footprint concept and, through the Water Footprint Network, standardised how to measure green, blue and grey water.
Green, blue and grey water
Virtual water is usually broken down into the three components of the water footprint:
- Green water: rainwater stored in soil and used by crops.
- Blue water: surface and groundwater withdrawn for irrigation or processing.
- Grey water: the freshwater needed to dilute pollutants to meet water-quality standards.
For example, producing one kilogram of cotton or beef requires thousands of litres of water once all stages are added up, which is why these products carry a large virtual-water content.
Why virtual water matters
- Food and water security: importing virtual water in the form of food can relieve pressure on local water resources in arid regions.
- International trade: water-scarce countries effectively outsource part of their water footprint by importing water-intensive goods.
- Basin and resource planning: mapping virtual-water flows reveals external dependencies that conventional water statistics miss.
Virtual water in global trade
According to research by Hoekstra and Mekonnen, international trade in agricultural and industrial products mobilises roughly 2,300 cubic kilometres of virtual water per year, equivalent to about a quarter of the global water footprint. Major net exporters of virtual water include countries with abundant agricultural land such as the United States, Brazil, Argentina and Australia, while net importers tend to be densely populated or water-scarce economies. These flows mean that consumers in one region can indirectly contribute to water stress, or even aquifer depletion, in another.
Reduction strategies for companies
- Source water-intensive raw materials from basins with lower scarcity, assessed with indicators such as AWARE.
- Reformulate products to favour lower-water-footprint ingredients where feasible.
- Work with suppliers on efficient irrigation and water stewardship.
- Account for embedded water as part of value-chain impacts in sustainability reporting.
Related concepts
- Water footprint: the broader indicator from which virtual water is derived.
- Blue water scarcity: trade in virtual water can ease or worsen local blue-water deficits.
- Corporate water footprint: the virtual water embedded in a company's raw materials and products.
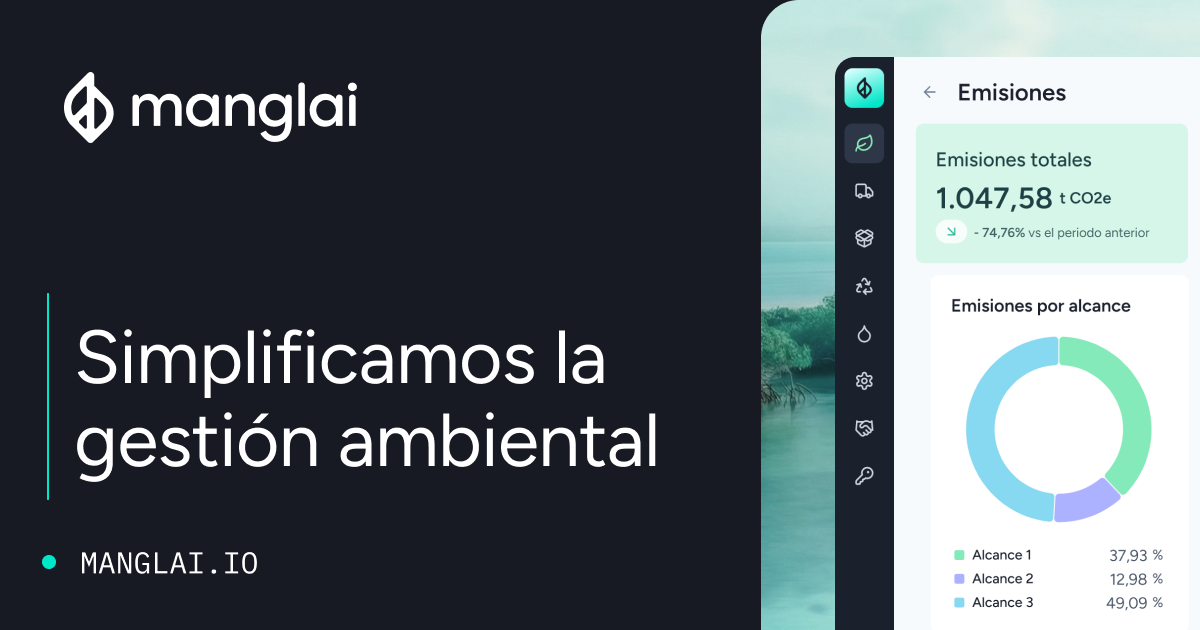
Measuring and managing virtual water helps companies and governments understand hidden water dependencies and contribute to Sustainable Development Goals 6 and 12. At Manglai we help companies measure their water footprint and prepare their sustainability reporting. Discover how Manglai can help you.
Companies that trust us
Related terms
See all termsWater Balance
A water balance quantifies the inputs, outputs and storage changes of water in a basin, city or company, revealing whether the resource is in surplus or deficit.
Corporate water footprint
A guide to the corporate water footprint: what it is, how it is calculated, which standards govern it and how companies use it to manage water risk.
End-of-life carbon footprint
The end-of-life carbon footprint quantifies the emissions, and the avoided emissions, linked to what happens to a product once it is discarded: collection, recycling, recovery or disposal.
Guiding businesses towards net-zero emissions through AI-driven solutions.
Product & Pricing
What is Manglai
Features
SQAS
GLEC
Miteco certification
ISO-14064
CSRD
Prices
Customers
Partners
Solutions by role
ESG management solutions
Environmental consulting
Financial directors
General directors
Operations directors
Transport responsible
Supply chain managers
Solutions for investment funds
© 2026 Manglai. All rights reserved