Water footprint
2025 06 02
•
4 MIN
How to measure the corporate water footprint step by step
Paula Otero
Environmental and Sustainability Consultant

The corporate water footprint is the total volume of freshwater that a company consumes and pollutes across its entire value chain, from the extraction of raw materials to final use. Measuring it rigorously lets you pinpoint critical consumption points, reduce costs, anticipate the risk of scarcity, and respond to the new sustainability reporting requirements.
This guide sets out a clear, step-by-step method so your company can quantify its water impact and manage it with data.
Why should companies measure their water footprint?
Measuring the corporate water footprint brings three main benefits:
- Compliance and reporting: frameworks such as the CSRD and its ESRS E3 (water and marine resources) standard require companies in scope to report on water consumption, discharges, and dependency. Voluntary initiatives such as CDP Water Security also request this data.
- Access to sustainable finance: investors and finance linked to environmental criteria value having verified water metrics.
- Operational efficiency: auditing processes makes it possible to detect leaks, overconsumption, and reuse opportunities, which reduces the cost of water and the associated energy.
Methodology to measure the corporate water footprint, step by step
Measuring the corporate water footprint is not a simple accounting exercise: it is the foundation of data-driven water management. The process draws on two complementary reference frameworks, the volumetric method of the Water Footprint Network and the impact-oriented ISO 14046 standard.
Step 1: define the scope
The company must set its operational boundaries and include factories, offices, and logistics operations. The key decision is whether to extend the analysis to the supply chain (upstream), where much of the footprint is often concentrated, especially when agricultural raw materials are involved. To delimit processes, our guide on how to calculate the water footprint of a product or activity can help.
Step 2: collect data
A reliable measurement starts from good-quality consumption data: meter and flowmeter readings, water bills, balances from cleaning processes, and discharge data. The more granular the information (by process, line, or facility), the easier it is to detect leaks and deviations. Digitalising meters and using sensors makes monitoring and alerts easier, although it is best to avoid claiming specific savings without measuring them case by case.
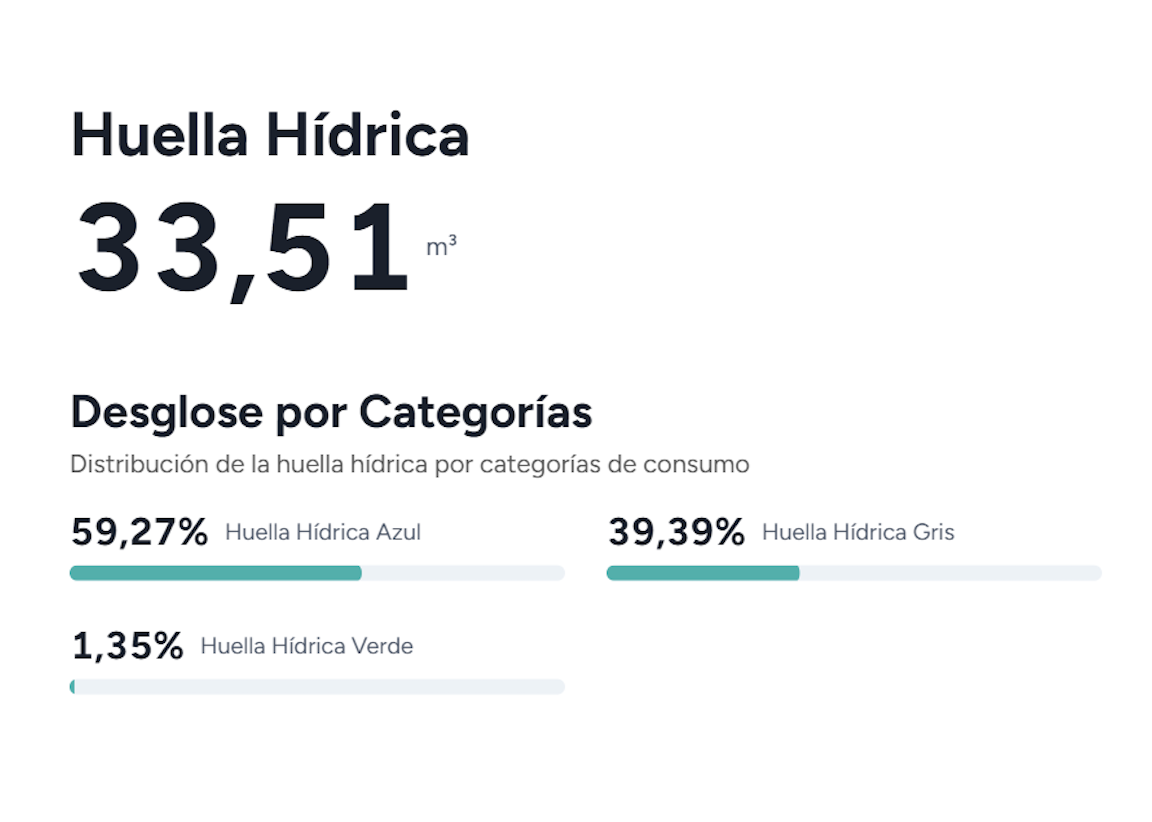
Step 3: distinguish the blue, green, and grey footprint
The water footprint breaks down into three parts:
- Blue: surface or groundwater (mains, wells, rivers) that is consumed.
- Green: rainwater embedded in crops and biomass, relevant when there are agricultural raw materials (for example, the cardboard in packaging).
- Grey: the volume of freshwater needed to dilute the pollutants discharged until they meet quality standards.
Step 4: calculate each component
The blue and green footprint are obtained by adding up the water consumed at each stage. The grey footprint is calculated, following the Water Footprint Network methodology, by dividing the pollutant load discharged by the difference between the maximum acceptable concentration and the natural concentration of the receiving water body:
Grey WF = L / (C max − C nat)
- L: pollutant load discharged (mass per unit of time, for example kg/year).
- C max: maximum acceptable concentration of the pollutant under the regulations (mg/L).
- C nat: natural concentration of the pollutant in the receiving water body before the discharge (mg/L).
If you follow ISO 14046, that volume is also translated into impact weighted by the scarcity of the basin, using characterisation factors such as the AWARE coefficient.
Key indicators of the corporate water footprint
Once the footprint has been calculated, it is worth translating it into indicators that can be compared over time. The most common are:
| Indicator | Calculation | What it is for |
|---|---|---|
| Water intensity per product | Total water volume / output (m³ per tonne or per unit) | Comparing efficiency across plants and years |
| Cost per m³ | Total water spend (€) / total volume (m³) | Quantifying the economic impact of water |
| Blue footprint share | (Blue volume / total volume) × 100 | Prioritising action in water-stressed areas |
| Intensity over revenue | m³ consumed / € of revenue | Normalising the footprint to the size of the business |
Each company should set its own reduction targets based on its baseline and the context of each basin, rather than applying generic values.
Strategies to optimise the corporate water footprint
Once the footprint has been measured, the most common improvement levers are:
- Water life cycle assessment: applying a water life cycle assessment (Water LCA) helps identify the highest-consumption processes and prioritise investments where the return is greatest.
- Reuse and reclaimed water: using reclaimed water in non-critical applications reduces the pressure on potable sources, within what the reuse regulations allow.
- Rainwater harvesting: making use of rainwater on industrial roofs for non-critical processes lowers the blue footprint.
- Process efficiency: optimising cleaning, cooling, and effluent treatment reduces the blue and grey components.
To go deeper into life cycle methodology, see our article on methods and tools for life cycle assessment, and for water management cases, the guide to corporate water responsibility.
Measure to manage and lead
Companies that monitor their water footprint gain operational resilience and the ability to respond to customers and investors. The process described (define, collect, classify, calculate, and normalise) provides a solid basis for reducing consumption and reporting transparently.
To calculate your corporate water footprint quickly, you can use Manglai's water footprint calculator.
Frequently asked questions about how to measure the water footprint in companies
What is the difference between measuring and offsetting the water footprint?
Measuring quantifies consumption and impact; offsetting means investing in projects that replenish or improve water in the same basin. Measurement is always the first step.
How often should the corporate water footprint be reviewed?
The usual practice is to review it annually, aligned with sustainability reporting. In sectors or locations with high water risk, more frequent monitoring is advisable.
Which international standard is used to calculate the corporate water footprint?
There is no legally mandatory standard of general application. ISO 14046 is the international reference standard for water footprint assessment based on life cycle, and the Water Footprint Network methodology is the volumetric reference.
Does digitalisation help reduce water consumption?
Yes. Sensors, continuous monitoring, and data analysis make it possible to detect leaks and overconsumption sooner and more precisely, although the specific saving depends on each facility.
To measure and manage your company's water with auditable data, discover Manglai's water footprint module.
Paula Otero
Environmental and Sustainability Consultant
About the author
Biologist from the University of Santiago de Compostela with a Master’s degree in Natural Environment Management and Conservation from the University of Cádiz. After collaborating in university studies and working as an environmental consultant, I now apply my expertise at Manglai. I specialize in leading sustainability projects focused on the Sustainable Development Goals for companies. I advise clients on carbon footprint measurement and reduction, contribute to the development of our platform, and conduct internal training. My experience combines scientific rigor with practical applicability in the business sector.
Content
Companies that trust us


Water footprint
Territorial water footprint: how municipalities manage water
The territorial water footprint measures the volume of freshwater used within a territory (a municipality, a region or a river basin) or appropriated ...
Water footprint
Corporate water responsibility: keys to managing water in business
In Spain and across much of southern Europe, water scarcity has become an operational risk as tangible as the cost of energy. Pressure on river basins ...
Water footprint
Water Footprint in Agriculture: The Impact of Water Use on crops
According to the FAO, agriculture uses around 70% of the fresh water withdrawn worldwide . This figure places the primary sector at the centre of the ...
Guiding businesses towards net-zero emissions through AI-driven solutions.
Product & Pricing
What is Manglai
Features
SQAS
GLEC
GHG Protocol
ISO-14046
ISO-14064
Miteco certification
CSRD
CSDDD
Digital Product Passport
EINF
Prices
Customers
Partners
Solutions by role
Environmental consulting
ESG management solutions
Financial directors
General directors
HR managers
Operations directors
Quality and environment directors
Senior management
Solutions for investment funds
Supply chain managers
Sustainability managers
Transport responsible
© 2026 Manglai. All rights reserved