Water footprint
2025 07 02
•
3 MIN
What is virtual water and how does it affect water consumption?
Carolina Skarupa
Product Carbon Footprint Analyst
The water we see when we turn on the tap or fill a bottle is only the visible part of our water consumption. Most of it is hidden in the goods we buy and the services we use: this is virtual water. The concept was introduced by the British geographer Tony Allan in 1993, at King's College London and SOAS, to describe the volume of water embedded in crops, textiles, fuels or electronic devices. For this contribution he received the Stockholm Water Prize in 2008, regarded as the leading international award in the field.
Reducing this invisible share has become a strategic goal for governments and companies, because it shapes water security and the resilience of supply chains. This article explains what virtual water is, its impact and how to manage it.
What is virtual water?
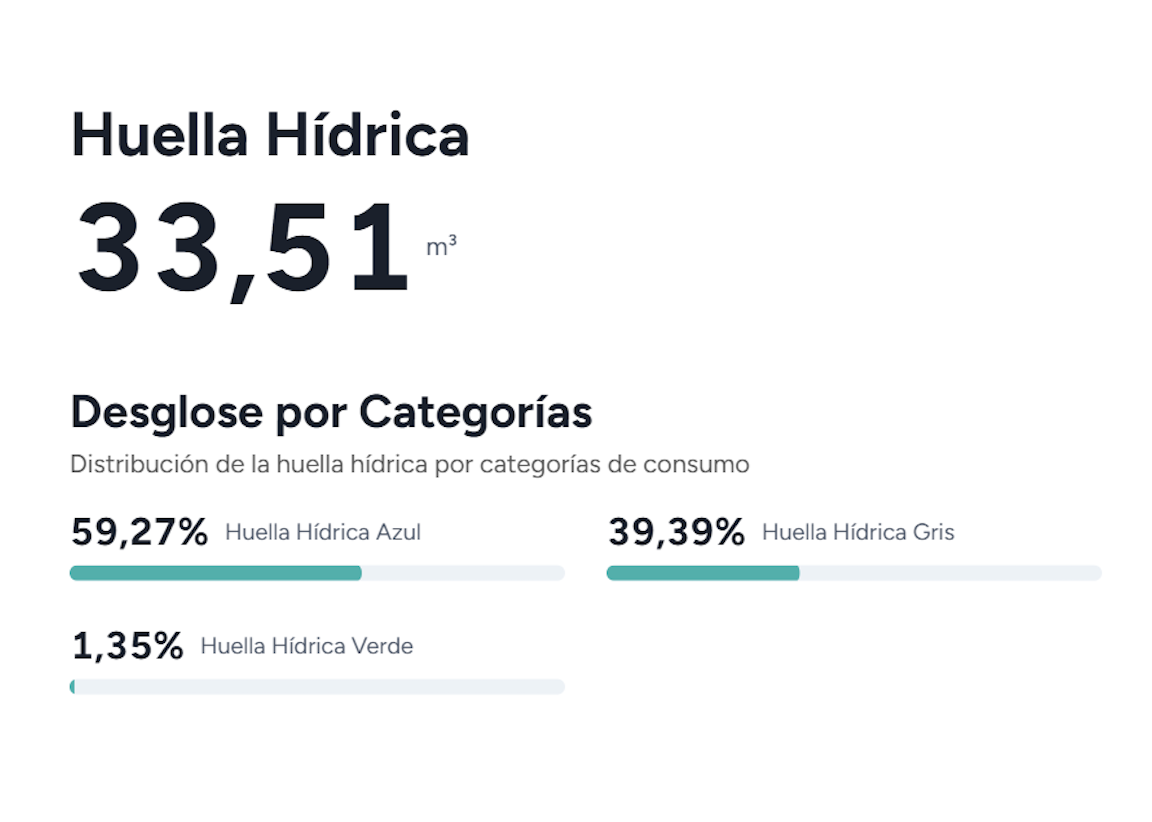
Virtual water is the total water used throughout a product's life cycle, which then "travels" figuratively with it to the final consumer. That volume brings together the three components of the water footprint: the blue water from rivers and aquifers, the green water from rain stored in the soil, and the grey water associated with assimilating pollutants.
This is why every purchase we make relocates, in a sense, part of the basin where the original raw material was produced.
The macroeconomic dimension of virtual water
International trade moves enormous volumes of virtual water. According to the estimates of Hoekstra and Mekonnen (Water Footprint Network), the virtual-water flows associated with the trade of agricultural and industrial products averaged around 2,300 km³ per year over the period 1996-2005, most of it linked to the trade in crops and derived products.
Spain is a net importer of virtual water: cereals, soy, coffee and textiles come in, while fruit, vegetables and olive oil go out. This external water balance eases the pressure on domestic resources, but externalises part of the footprint to countries that, in many cases, already suffer water stress. This is the outsourcing of water consumption, a key factor in any corporate water-responsibility strategy, which we develop in our article on how to measure the corporate water footprint.
Virtual water in food
The average values estimated by the Water Footprint Network (Mekonnen and Hoekstra) reveal differences that surprise consumers. These are global averages and should be understood as estimates:
- Coffee: around 18,900 litres per kilogram of roasted coffee, mostly green water.
- Beef: around 15,400 litres per kilogram as a global average, mainly from the feed and the water the cattle drink.
- Chocolate: close to 17,000 litres per kilogram, owing to the water needs of cocoa and sugar.
- Wheat: around 1,600 litres per kilogram; high, but far below that of beef.
These orders of magnitude help to explain why diet and purchasing decisions have a real bearing on water consumption.
Relationship with the water footprint
Virtual water does not replace the water footprint: it complements it. While the total water footprint combines internal and external use, virtual water focuses on the part that is "imported" or "exported" through trade. Calculating both measures makes it possible to decide whether to optimise local processes or rethink the procurement strategy.
In our guide on how to calculate the water footprint of a product or activity we explain the methodology step by step.
Strategies to reduce virtual water
The companies that lead their sector usually apply several measures to reduce the virtual water of their products:
- Smart sourcing: select raw materials from regions with good water availability so as not to shift pressure onto vulnerable basins.
- Prioritise rain-fed crops: favour production with a higher proportion of green water over intensively irrigated crops.
- Require good water-management practices: work with suppliers that can demonstrate responsible use, for example through recognised water-stewardship standards such as that of the Alliance for Water Stewardship (AWS).
- Measure to decide: calculate the virtual-water factors of each product to identify lower-impact alternatives.
Virtual water: the hidden side of water consumption
Measuring virtual water helps companies and consumers to make informed decisions, reduce risks and move towards fairer and more resilient water management.
If you want to go deeper, we invite you to explore our resources on the water footprint, life cycle assessment (LCA) and imported virtual water.
Frequently asked questions about virtual water
Do we pay for virtual water on the bill?
Indirectly: the water and energy costs of the entire production chain are passed on to the final price of the product, even though they do not appear as a separate line item.
Can virtual water be offset like CO₂ emissions?
There are water offsetting initiatives, but the priority is to reduce real consumption at source. Offsetting water is more complex than offsetting carbon, because water is a local resource: what is saved in one basin is not equivalent to what is consumed in another.
Who coined the concept of virtual water?
The British geographer Tony Allan, in 1993. His work earned him the Stockholm Water Prize in 2008.
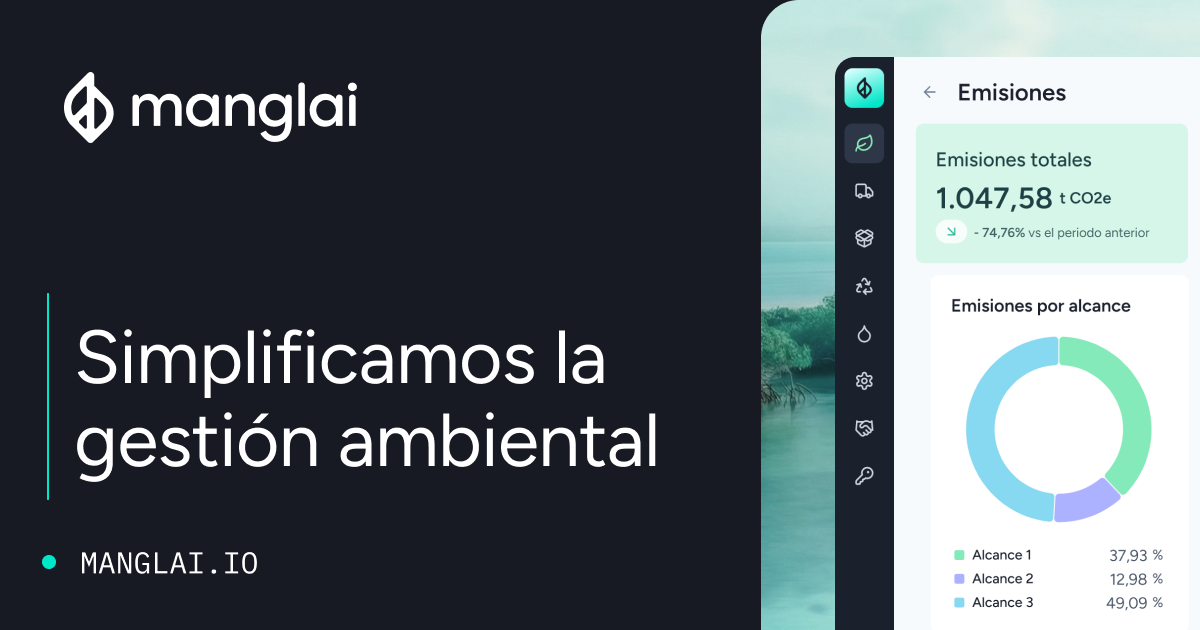
To calculate and manage the virtual water of your products with traceable data, you can rely on Manglai's water footprint solution.
Carolina Skarupa
Product Carbon Footprint Analyst
About the author
Graduated in Industrial Engineering and Management from the Karlsruhe Institute of Technology, with a master’s degree in Environmental Management and Conservation from the University of Cádiz. I'm a Product Carbon Footprint Analyst at Manglai, advising clients on measuring their carbon footprint. I specialize in developing programs aimed at the Sustainable Development Goals for companies. My commitment to environmental preservation is key to the implementation of action plans within the corporate sector.
Content
Companies that trust us
Water footprint
The water-energy nexus: how energy efficiency reduces your water footprint
Water and energy form an interdependent system that directly influences the environmental footprint of any organisation. Much of the energy we consume ...
Water footprint
Water neutrality: is it an achievable goal for industry in Spain?
Water neutrality has become one of the most talked-about concepts in environmental management across Europe. Regulatory pressure, water stress, and co ...
Water footprint
Technologies to optimise the water footprint in the textile and agri-food industries
Efficient water management has become one of the pillars of industrial sustainability. In sectors with high water consumption, such as textiles and ag ...
Guiding businesses towards net-zero emissions through AI-driven solutions.
Product & Pricing
What is Manglai
Features
SQAS
GLEC
Miteco certification
ISO-14064
CSRD
Prices
Customers
Partners
Solutions by role
ESG management solutions
Environmental consulting
Financial directors
General directors
Operations directors
Transport responsible
Supply chain managers
Solutions for investment funds
© 2026 Manglai. All rights reserved