Life Cycle Inventory (LCI)
The LCI is the second phase of LCA under ISO 14044. It consists of collecting and quantifying all input and output flows (materials, energy, water, emissions, and waste) associated with a product, process, or service within the defined system boundaries. The LCI provides the numerical foundation used to calculate environmental impacts later in the Life Cycle Impact Assessment (LCIA) phase.
Purpose of the LCI
- Provide a detailed and transparent inventory of resources used and emissions generated.
- Enable identification of high-impact “hotspots” to guide eco-design improvements.
- Serve as a verifiable input for Environmental Product Declarations (EPDs) and Digital Product Passports (DPPs).
- Improve comparability between alternatives when consistent boundary and allocation rules are applied.
Types of Data in an LCI
Material inputs: minerals, biomass, chemicals, fuels.
Energy inputs: electricity, heat, steam, auxiliary fuels.
Water inputs: blue, green, or recycled water withdrawals.
Outputs: air emissions (CO₂, CH₄, NOₓ), water discharges (COD, metals), solid waste (hazardous/non-hazardous), and co-products.
Internal transport: distances and modes between unit processes.
Capital inventory (optional): machinery, infrastructure, amortised buildings.
Step-by-Step Methodology
- Define system boundaries and the functional unit.
- Break down the system into unit processes (process map).
- Collect primary data from facilities and direct suppliers (Tier 1).
- Assign secondary data from databases such as ecoinvent, Agrifootprint, or GaBi for background processes.
- Balance inputs and outputs: verify mass and energy conservation principles.
- Normalise and scale results to the functional unit.
- Document data quality: precision, and temporal, geographic, and technological representativeness.
- Independent expert critical review (required for Type III EPDs or comparative studies).
Data Sources and Tools
Databases: ecoinvent v3.9, GaBi ts, USLCI, ELCD, IDEA, Ökobau.dat.
Software tools: SimaPro, OpenLCA, GaBi, One Click LCA, Tally, Brightway2.
On-site measurement: flow meters, IoT sensors, SCADA for energy and water consumption.
Suppliers: safety data sheets, sustainability reports, tailored questionnaires.
Common Challenges
- Lack of primary data in Tier 2 and Tier 3 supply chain levels.
- Co-product allocation: multi-output systems require mass, energy, or economic value rules.
- Confidentiality: suppliers may be reluctant to share information.
- Temporal inconsistencies: datasets from different years reduce accuracy.
- Accounting for change over time: technology and electricity mixes evolve and require periodic updates.
Best Practices
- Implement supplier data agreements for annual reporting of inputs.
- Use plant digital twins for automated, granular data capture.
- Follow ILCD recommendations for data quality documentation.
- Apply Monte Carlo sensitivity analysis to assess uncertainty.
- Align the LCI with water footprint and embodied carbon assessments for multidimensional consistency.
Case Study: Low-Carbon Cement LCI (2024)
Functional unit: 1 tonne of clinker.
Main inputs: 1.35 t limestone, 120 kg marl, 85 kWh electricity, 3.1 GJ petroleum coke.
Outputs: 680 kg CO₂ from calcination, 120 kg CO₂ from combustion, 1 kg NOₓ, 0.1 kg PM₁₀, 25 kg granulated slag (co-product).
Improvement: replacing 30% of coke with biomass residues reduced total CO₂ emissions in the inventory by 18%.
Integration with LCIA and EPDs
The LCI feeds the LCIA phase using methods such as CML, ReCiPe 2016, AWARE, and TRACI. Results are then summarised in verified EPDs under EN 15804+A2 or ISO 21930. Relevant LCI data is also linked to the Digital Product Passport (DPP) required by the ESPR Regulation.
Future Outlook
- Automation via IoT and blockchain for real-time traceability.
- Sector-wide harmonisation of factors and nomenclatures (European Industrial Data Strategy).
- ML/AI integration for gap-filling and improving data quality.
- “Dynamic LCA” approaches that capture temporal variability in processes and electricity mixes.
A comprehensive, high-quality LCI is the cornerstone of any data-driven sustainability strategy. It provides the transparency needed to eco-design, reduce carbon and water footprints, and comply with emerging European regulatory requirements such as the ESPR and CSRD.
Companies that trust us

Related terms
See all termsEmbodied Carbon Footprint
The embodied carbon footprint is the sum of emissions from raw material extraction to the factory gate. We explain how it is calculated and how to reduce it.
Direct Water Footprint
The direct water footprint measures the water consumed and polluted by a company's own facilities and processes. We explain how it is calculated and reduced.
Indirect Water Footprint
The indirect water footprint covers the water used upstream in an organisation's supply chain, often the largest share of its total footprint. Here is how to measure and reduce it.
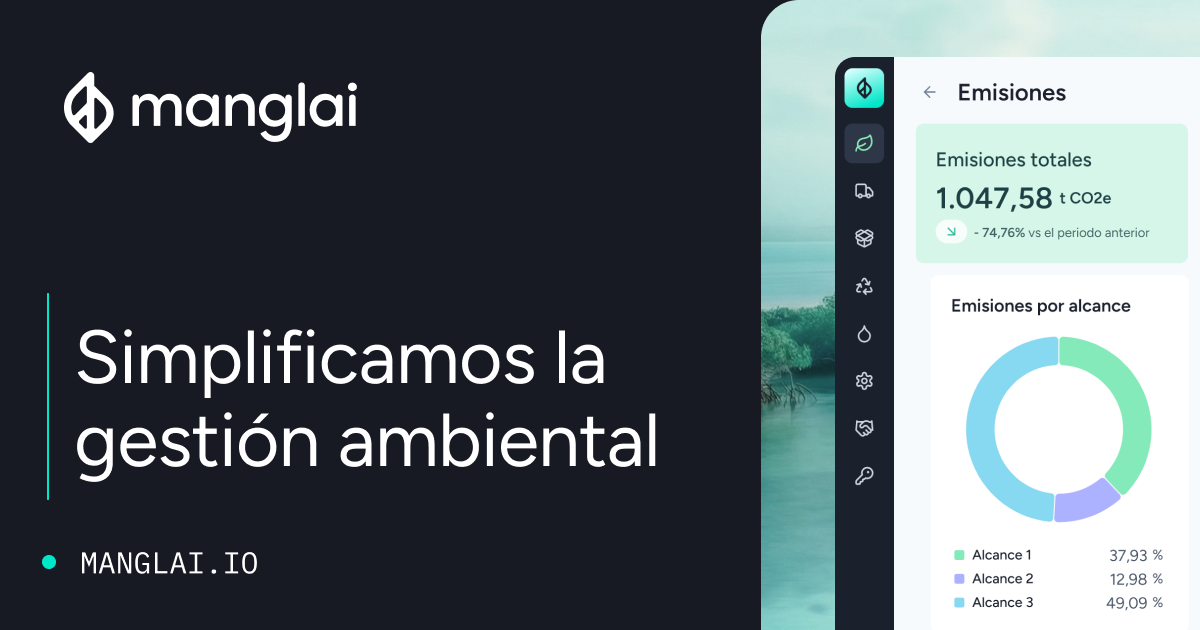
Guiding businesses towards net-zero emissions through AI-driven solutions.
Product & Pricing
What is Manglai
Features
SQAS
GLEC
Miteco certification
ISO-14064
CSRD
Prices
Customers
Partners
Solutions by role
ESG management solutions
Environmental consulting
Financial directors
General directors
Operations directors
Transport responsible
Supply chain managers
Solutions for investment funds
© 2026 Manglai. All rights reserved